TAU at TACC
Last update: June 24, 2024
The University of Oregon's open-source TAU (Tuning and Analysis Utilities) package provides performance evaluation by profiling (reporting global statistics) and tracing (how events in parallel tasks interact in time) your code.
Use TAU to gain insight into the performance and behaviour of your code: what routines take the most time, identifying load imbalances in a parallel run. TAU has some overlap in functionality with VTune. The difference lies in the fact that VTune can trace any binary, whereas TAU requires instrumentation. This means that TAU requires recompilation of your code, which may be cumbersome. On the other hand, TAU output is easier to understand since it relates to subroutine names in your code.
TAU is installed on all TACC's HPC systems and is controlled through the Lmod/module system. To set up and examine your TAU environment:
login1$ module load tau
login1$ env | grep TAU  #display package-specific environment variables
login1$ module help tau #basic operations & features
Using TAU
- Instrument your code by recompiling with TAU scripts
- Launch your new executable either interactively through an
idevsession or through a batch job. - Process the TAU output
1. Instrumenting your Code
To use TAU, you need to recompile your code using some TAU compiler wrappers (scripts). Behind the scenes these scripts do a source-to-source instrumentation phase, followed by a regular compilation. The TAU compilation scripts are:
login1$ tau_f90.sh
login1$ tau_cc.sh
login1$ tau_cxx.sh
These compiler wrappers can be used directly on a command line or within a makefile:
login1$ tau_cc.sh -o myprogram myprogramfile.cUse the -tau:help option after the compiler wrapper command to see useful TAU options.
For a makefile that works both with and without TAU, use:
ifdef TACC_TAU_DIR
  FC = tau_f90.sh
  CC = tau_cc.sh
  CXX = tau_cxx.sh
else
  FC = mpif90
  CC  = mpicc
  CXX = mpicxx
endif

%.o : %.cxx
    ${CXX} -c $*.cxx
Behind the scenes, compiler wrappers create and execute a simple makefile that includes appropriate makefile options from an include makefile stored in the $TAU_MAKEFILE variable. Include makefiles are stored in the $TACC_TAU_LIB directory. The default $TAU_MAKEFILE value will provide normal MPI and hybrid (MPI/OpenMP) instrumentation. Set the variable to $TACC_TAU_LIB/Makefile.tau-intelomp-icpc-papi-ompt-pdt-openmp for pure OpenMP codes.
2. Running
After instrumentation/compilation you have a regular binary that you can run, with MPI or OpenMP settings as needed. Then, launch an interactive or batch job, using this new binary. Control and configure TAU output with the following environment variables:
| Environment Variable | Description |
|---|---|
TAU_PROFILE |
Set to 1 to turn on profiling (statistics) information. |
PROFILEDIR |
Set to the name of a directory; otherwise output goes to the current directory. |
TAU_TRACE |
Set to 1 to turn on tracing (timeline) information. |
TRACEDIR |
Set to the name of a directory. You can safely use the PROFILEDIR value. |
Set up your environment in a batch script or idev session:
login1$ idev
...
c455-073[knl]$ cd mytaudir; mkdir -p profiles
c455-073[knl]$ export PROFILEDIR=`pwd`/profiles
c455-073[knl]$ ibrun myprogram                  #profiling is on by default
...
c455-073[knl]$ mkdir -p traces
c455-073[knl]$ export TRACEDIR=`pwd`/traces
c455-073[knl]$ export TAU_PROFILE=0 TAU_TRACE=1
...
c455-073[knl]$ ibrun myprogram
#SBATCH directives
...
export PROFILEDIR=mytaudir/profiles
export TRACEDIR=mytaudir/traces
ibrun myprogram
...
export TAU_PROFILE=0
export TAU_TRACE=1
ibrun myprogram
Then run your program as normal. Once execution finishes, you can process and examine the TAU profile and/or tracing output.
3. Process program output
After your program runs you can process TAU's output to do two things: view statistics and analyze trace data. The TAU package includes two visualization tools, ParaProf, and Jumpshot. See Remote Desktop Access at TACC for instructions on setting up visual connections to TACC resources.
-
Display global statistics with TAU's 3D profile browser, ParaProf (Figure 1.):
xterm$ paraprof ${PROFILEDIR}
Figure 1. Sample profile output courtesy of Livermore Computing Center -
To analyze the trace data,
-
First, generate the trace data:
login1$ cd ${TRACEDIR} # change to the directory containing trace files login1$ rm -f tau.trc tau.edf # remove any previous output files login1$ tau_treemerge.pl # merge all the trace files into one directory login1$ tau2slog2 tau.trc tau.edf -o yourprogram.slog2 # create viewable files -
then visualize that data using another TAU package, Jumpshot (Figure 2.):
xterm$ jumpshot yourprogram.slog2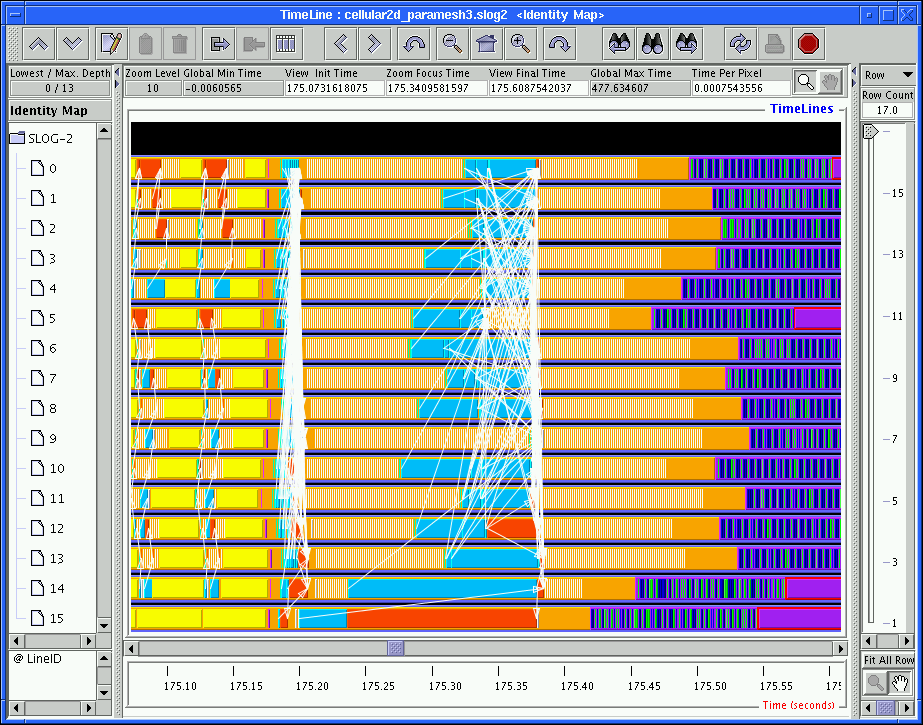
Figure 2. Sample tracing output courtesy of Argonne National Laboratory
-