Remora - Resource Monitoring for Remote Applications
Last update: August 21, 2019
REMORA stands for REsource MOnitoring for Remote Applications. Remora provides a simple interface to gather important system utilization data while running on HPC systems. Remora monitors almost all user activities and provides per-node and per-job resource usage data for users. These collected data can be used to improve code performance or detect unusual issues. The reports can help users achieve a better understanding of their applications with total-run average resource usages and resource-usage timelines. This information can provide the first-level of information for improving codes.
REMORA uses shell scripts as a framework, includes external tools, and accesses /sys and /proc files for kernel data. It reports a brief summary at the end of the run. Timeline reports from records taken during an application run, are included in text files, labeled by the content and node name, in a remora_*jobid* subdirectory. The text files contain timeline information on memory, CPU loads, network traffic, IO load, NUMA memory, power, and temperature. More comprehensive Google timeline plots and graphs are created in html files, and can be downloaded and opened on the user’s laptop.
Running Remora
Remora is installed on all TACC compute resources. You can use remora interatively on a compute node via an idev session or in a batch job as shown below.
Interactively
login1$ idev
c123-456$ module load remora
c123-456$ remora myserialcode args
Remora in Job Scripts
Modify your batch script and include 'remora' before your script, executable, or MPI launcher within your script as shown below:
#!/bin/bash
#SBATCH -J myjob                # Job name
#SBATCH -oe myjob.o%j           # Name of stdout/stderr output file
#SBATCH -p normal               # Queue (partition) name
#SBATCH -N 1                    # Total # of nodes (must be 1 for serial)
#SBATCH -n 16                   # Total # of mpi tasks (should be 1 for serial)
#SBATCH -t 01:00:00             # Run time (hh:mm:ss)
#SBATCH -A myproject            # Allocation name (req'd if you have more than 1)

module load remora
remora ibrun ./my_parallel_job  # or "remora ./serial_job" if running a serial job
Remora Options
Users can configure REMORA to achieve the amount of detail that they want and perform the analysis of the results at any point in time. For short runs (less than several minutes) the environment variable $REMORA_PERIOD can be set to 1 to take snapshots ever second, instead of using the default 10 seconds. For longer executions set $REMORA_PERIOD to a larger value.
$REMORA_PERIOD- Interval in seconds between data record snapshots, default = 10 (sec)$REMORA_TMPDIR- FS for local data collection;
- use
/tmpfor long runs – less overhead
$REMORA_MODE- FULL (default): cpu, memory, network, luster ..
- BASIC: cpu, memory
- MONITOR: real-time reporting
Remora Output
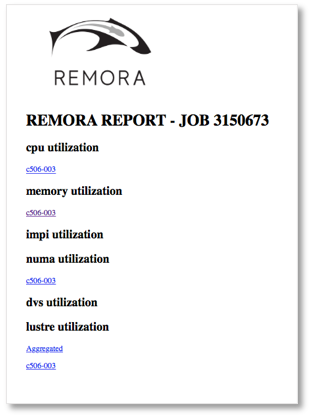
Remora will generate a summary report as shown below at the end of each job.

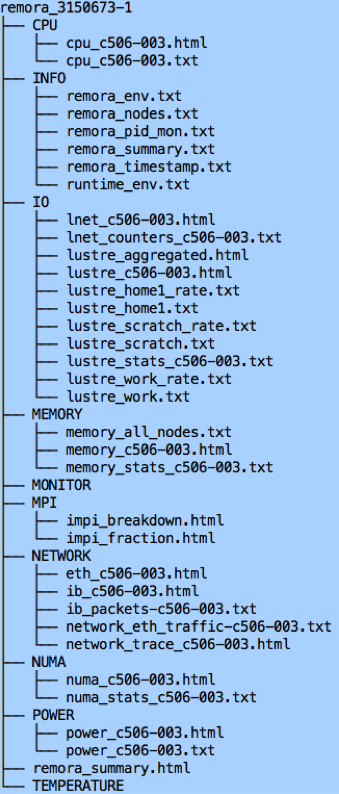
Remora will generate a series of files in the running directory like this.

References
Remora is an open-source project. You can find more detailed information about it from the published paper or remora's github repository.